
Fonts/sizes in matplotlib figures for LaTeX publications
Here are a few tips for making your matplotlib figures look really “right” in a LaTeX publication.
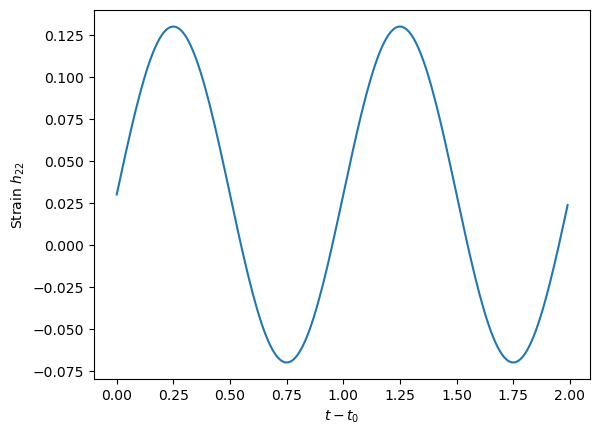
First, here’s what an mpl figure looks like with all the default
settings:
You probably already know the first tip: Let’s make it use LaTeX to
render math! You can set a certain one of the
rcParams:
mpl.rcParams['text.usetex'] = True
You only get a slight improvement:

You can see that some fonts don’t match—the non-LaTeX text isn’t in
Knuth’s famous font, Computer Modern. Ok, there are more rcParams
to tweak. Now let’s use an mplstyle
file
to put all our customizations in one place, so we can reuse it in all
our plotting scripts. An example mplstyle file might start:
text.usetex: True
text.latex.preamble: \usepackage{amsmath}\usepackage{amssymb}
font.family: serif
font.serif: Computer Modern
savefig.bbox: tight
savefig.format: pdf
...
Plus any other customizations you want, like making your ticks face
inward, turning on a horizontal grid, etc. Then in your python, use
it like so (assuming the file is named paper.mplstyle):
plt.style.use("paper.mplstyle")
Ok, now we got all the fonts we wanted:

Unfortunately, if we include it in a LaTeX document, it’s not going to
look right:
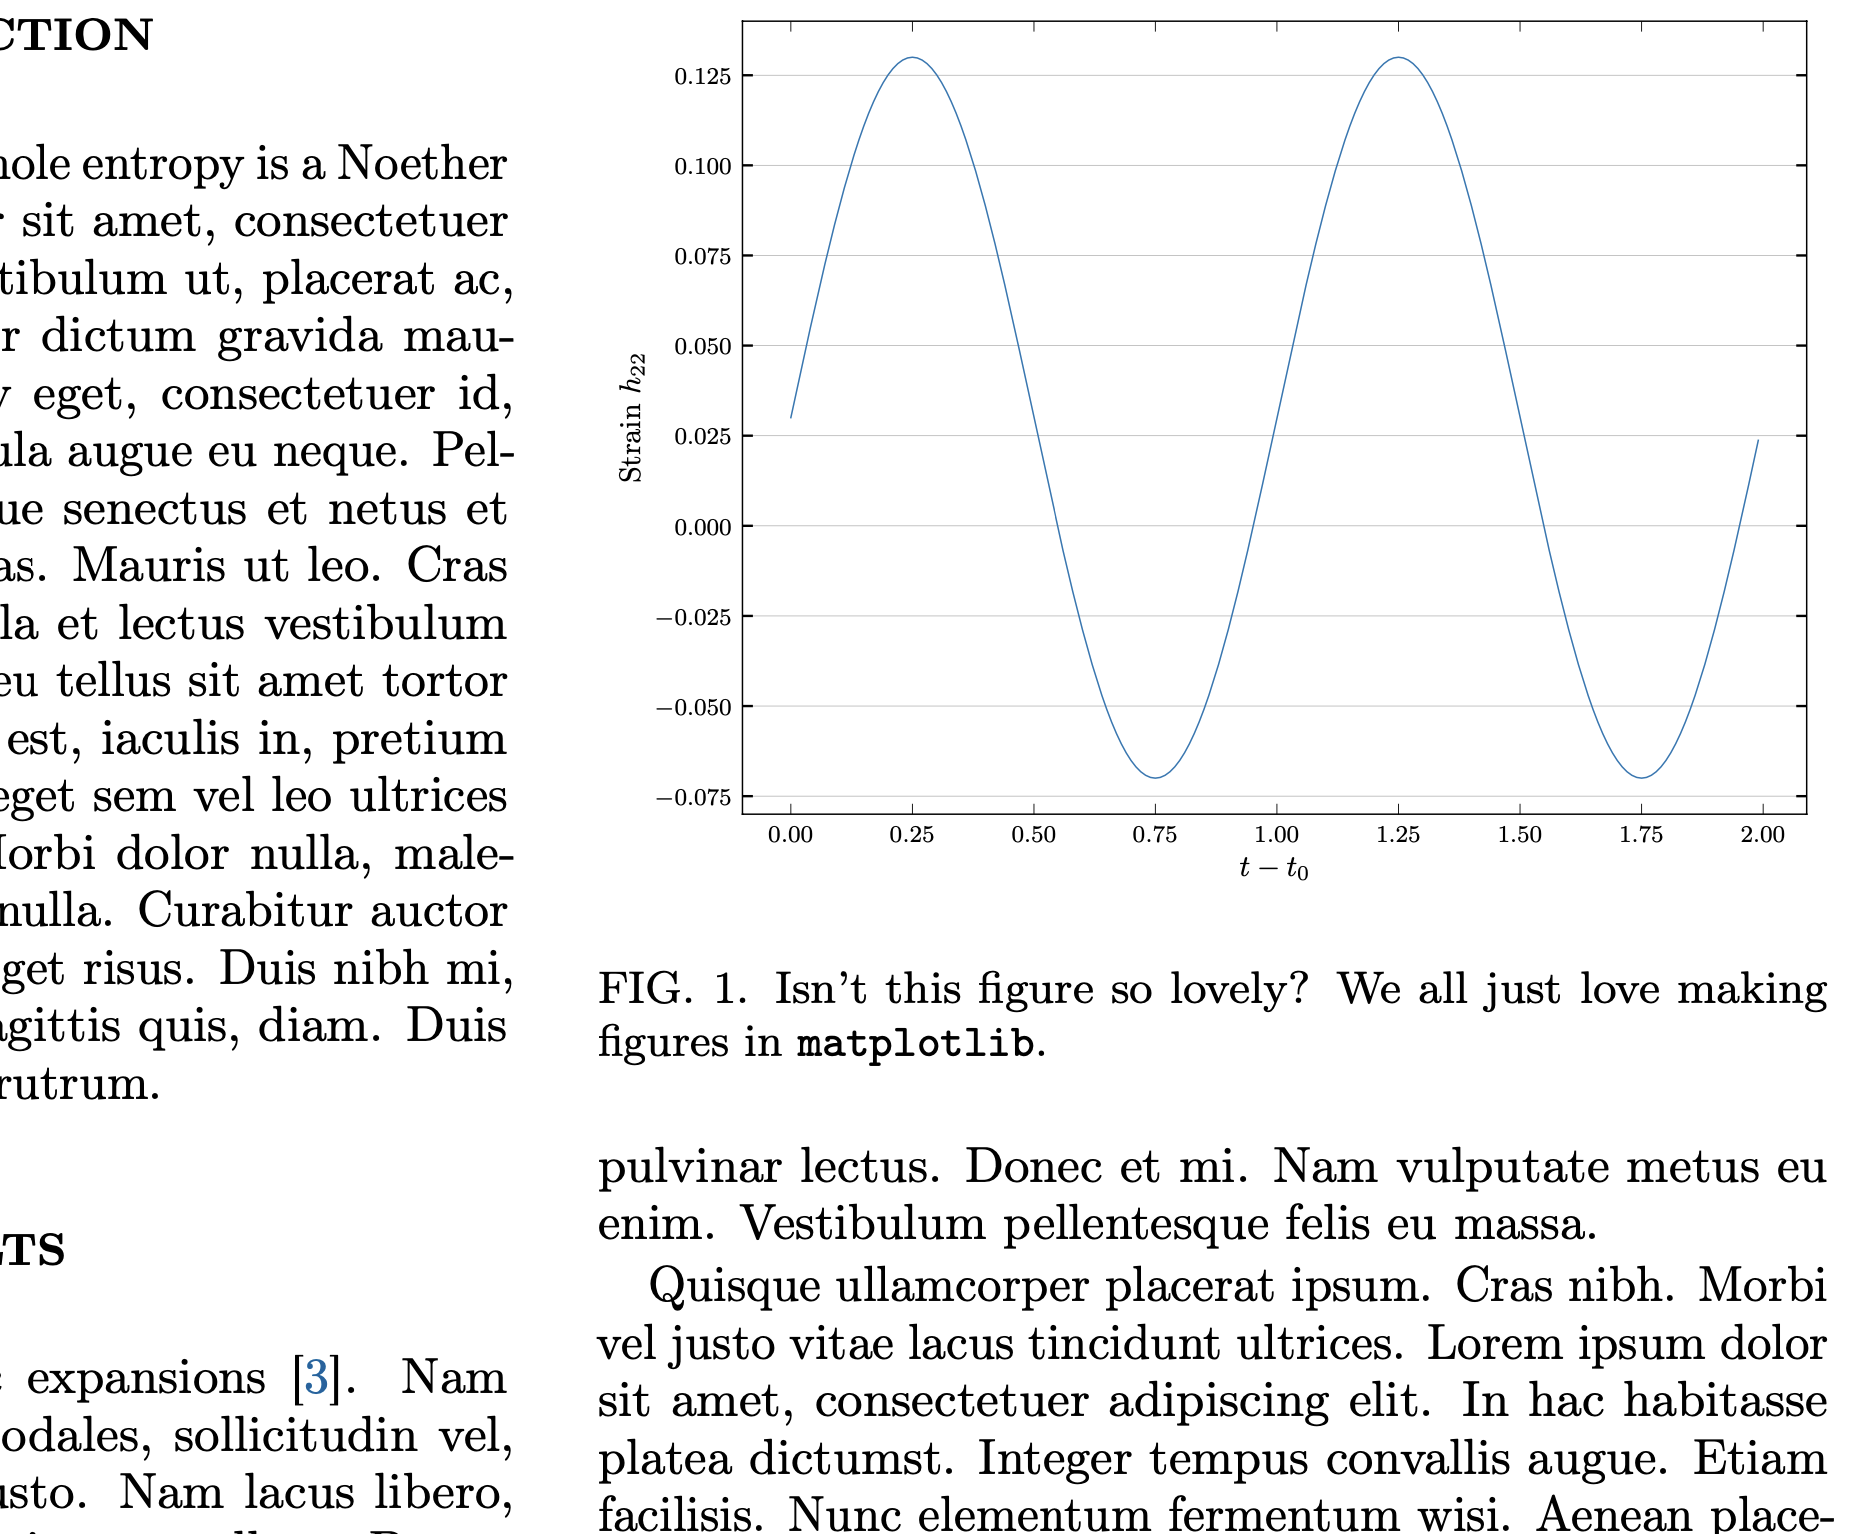
The main problem is What matplotlib thinks is 10pt font does not end
up as 10pt font in the LaTeX document. And why is that? Because the
mpl figsize is different from the size of the figure in the PDF.
If a journal’s style guide tells you the widths of their columns, you have to use those when generating your figure in matplotlib. If it doesn’t tell you the width, you can use the printlen LaTeX package to print it out inside your document, e.g.:
...
% In the preamble
\usepackage{printlen}
...
% In a figure environment
  \begin{center}
    \includegraphics[width=\columnwidth]{lovely_figure}
  \end{center}
  \caption{%
    \label{fig:lovely}
    In this figure caption, I can see that the width of
    one column is \printlength{\columnwidth}.}
...
Or to get any other length you want, e.g. \textwidth. (If you want to
view a summary of the current page geometry with many lengths, try the
layout package.) Once we find the
correct length, we use it in our python script:
pt = 1./72.27 # Hundreds of years of history... 72.27 points to an inch.

jour_sizes = {"PRD": {"onecol": 246.*pt, "twocol": 510.*pt},
              "CQG": {"onecol": 374.*pt}, # CQG is only one column
              # Add more journals below. Can add more properties to each journal
             }

my_width = jour_sizes["PRD"]["onecol"]
# Our figure's aspect ratio
golden = (1 + 5 ** 0.5) / 2

fig = plt.figure(figsize = (my_width, my_width/golden))
At last, our fonts and sizes from our matplotlib figures will be as
intended in our LaTeX document:

You can get an example mplstyle file, the python code that made all the figures, and the LaTeX code that made the example document at this github repository.